This section briefly introduces Excel worksheet functions and, with simple examples, explains how to use them in Excel, Excel VBA, and Python under various scenarios.
Introduction to Excel Worksheet Functions
Excel worksheet functions are an important part of Excel. They can be used as a function library or regarded as a formula language.
Currently, there are more than 300 Excel worksheet functions. These include not only functions related to data types, operators, flow control, and functions (similar to a programming language) but also specialized functions in areas such as data analysis, finance, engineering, and statistics that are not available in VBA.
Therefore, mastering Excel worksheet functions can help users complete data processing tasks faster and better.
Using Worksheet Functions in Excel
As shown in Figure 4-1, column A of the worksheet contains five given data points. We now want to calculate the mean of these five data points and display it in cell C1. Enter the formula =AVERAGE(A1:A5) in cell C1 and press Enter—the mean of the given data, 4.8, is displayed in cell C1. The sample file path is Samples\ch16\ExcelFunction\Average.xlsx.
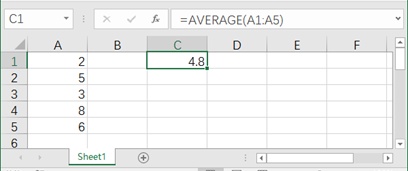
Figure 4-1 Calculating the mean of given data
Next, we calculate the deviation of the data in column A of the worksheet in Figure 4-1. The deviation of each data point equals the data point minus their mean. Enter the formula =A1-AVERAGE($A$1:$A$5) in cell B1, where "$" indicates that the corresponding position is fixed, and the AVERAGE function calculates the mean. Press Enter—the deviation between the first data point (2) and the mean (4.8) is -2.8, displayed in cell B1. Click cell B1, double-click the small square at its bottom-right corner to copy and fill the formula downward, and calculate the deviations for the other data points. The result is shown in column B of Figure 4-2. The sample file path is Samples\ch16\ExcelFunction\Divation.xlsx.
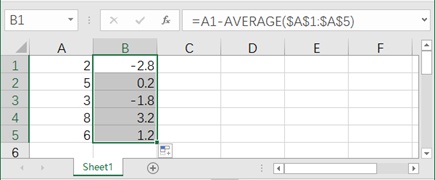
Figure 4-2 Calculating the deviation of given data
Now, using the data in column A of the worksheet in Figure 4-1, we calculate the maximum squared value of the data and display it in cell C1. Enter the formula =MAX(A1:A5*A1:A5) in cell C1, using array operations. A1:A5*A1:A5 calculates the square of each data point from A1 to A5, and the MAX function returns the largest squared value. After entering the formula in cell C1, press Ctrl+Shift+Enter simultaneously—the square of 8 (64), the largest squared value, is displayed in cell C1. The result is shown in Figure 4-3. The sample file path is Samples\ch16\Excel Function\Maximum squared value.xlsx.
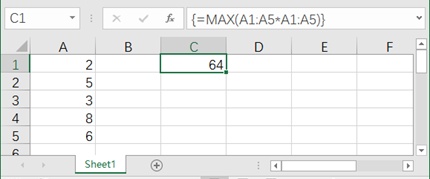
Figure 4-3 Calculating the maximum squared value of a set of data
Using Worksheet Functions in Excel VBA
Section 4.1.2 introduced several examples of using worksheet functions in Excel, which are representative in terms of operation. Below, we use Excel VBA to accomplish the same tasks. In Excel VBA, we can either directly call worksheet functions or use VBA’s own methods.
In Excel VBA, the WorksheetFunction property of the Application object can be used to call Excel worksheet functions. For the five data points in column A of the worksheet in Figure 4-1, the following code calculates their mean and displays the result in cell C1. The sample file path is Samples\ch16\Excel VBA\均值.xlsm.
Sub Test()
    Cells(1, 3) = Application.WorksheetFunction.Average(Range("A1:A5"))
End Sub
The above code uses the Average worksheet function to calculate the mean of the given data. Note that all function parameters must be set using the referencing method specified in Excel VBA.
The following code calculates the deviation of the data in column A of the worksheet in Figure 4-1. First, it calculates the mean of all data points, then computes the difference between each data point and the mean, and displays the result in column B. The sample file path is Samples\ch16\Excel VBA\Deviation.xlsm.
Sub Test()
    Dim intI As Integer
    Dim sngMean As Single
    ' Mean
    sngMean = Application.WorksheetFunction.Average(Range("A1:A5"))
    ' Deviation = Data - Mean
    For intI = 1 To 5
        Cells(intI, 2) = Cells(intI, 1) - sngMean
    Next
End Sub
We can also use the Evaluate method of the Application object to directly call the formula for calculating deviations from Section 4.1.2, as shown in the code below (Application can be omitted). If using the formula in Section 4.1.2 requires manually copying the formula downward to calculate deviations for other data points (semi-automated), using a For loop in Excel VBA enables truly automated calculation. The sample file path is Samples\ch16\Excel VBA\Deviation.xlsm.
Sub Test2()
    Dim intI As Integer
    For intI = 1 To 5
        ' Directly call the formula for calculation
        Cells(intI, 2) = Evaluate("=A" & intI & "-AVERAGE($A$1:$A$5)")
    Next
End Sub
In Section 4.1.2, the formula =MAX(A1:A5*A1:A5) was used to calculate the maximum squared value of the given data, where A1:A5*A1:A5 is a specific calculation format in worksheet functions that enables array operations via cell references. Although Excel VBA does not support this usage, we can use the Evaluate method to directly call the formula. The sample file path is Samples\ch16\Excel VBA\最大平方值.xlsm.
Sub Test2()
    Cells(1, 3) = Evaluate("=MAX(A1:A5*A1:A5)")
End Sub
If we do not use the Evaluate method, we need to use a For loop in Excel VBA to calculate the square of each data point and compare them to find the maximum squared value. The sample file path is Samples\ch16\Excel VBA\最大平方值.xlsm.
Sub Test()
    Dim intI As Integer
    Dim sngV As Single
    Dim sngMax As Single
    sngMax = 0
    For intI = 1 To 5
        sngV = Range("A" & intI)    ' Given data
        If sngMax < sngV * sngV Then   ' Get maximum squared value
            sngMax = sngV * sngV
        End If
    Next
    Cells(1, 3) = sngMax
End Sub
Using Worksheet Functions in Python
Because Python’s xlwings package uses the same object model as Excel VBA, we can also use worksheet functions via the WorksheetFunction property of the Excel Application object, or directly use formulas via the Evaluate method of the Excel Application object.
For the five data points in column A of the worksheet in Figure 4-1, the following code calculates their mean and displays the result in cell C1. In Python, we first need to import the xlwings and os packages, create an Excel application, open the data file, and get the worksheet; then use the Average worksheet function to calculate the mean of the data. The script file path is Samples\ch16\Python\Average.py.
import xlwings as xw   # Import xlwings package
import os               # Import os package
root = os.getcwd()     # Get current path
# Create Excel application (visible, no workbook added initially)
app = xw.App(visible=True, add_book=False)
# Open data file (writable)
bk = app.books.open(fullname=root + r'\均值.xlsx', read_only=False)
sht = bk.sheets.active  # Get worksheet
# Call Average function to calculate mean
sht.api.Cells(1, 3).Value = app.api.WorksheetFunction.Average(sht.api.Range('A1:A5'))
Calculating the deviation of each data point can be done in two ways:
Calculate the mean using the worksheet function, then compute the deviation for each data point via a for loop.
Directly call the formula using the Evaluate method.
In the code below, when using one method, comment out the other before running. The script file path is Samples\ch16\Python\Deviation.py.
import xlwings as xw   # Import xlwings package
import os               # Import os package
root = os.getcwd()     # Get current path
# Create Excel application (visible, no workbook added initially)
app = xw.App(visible=True, add_book=False)
# Open data file (writable)
bk = app.books.open(fullname=root + r'\离差.xlsx', read_only=False)
sht = bk.sheets.active  # Get worksheet
# Method 1: Calculate mean, then compute deviation via loop
m = app.api.WorksheetFunction.Average(sht.api.Range('A1:A5'))
for i in range(5):
    sht.api.Cells(i+1, 2).Value = sht.api.Cells(i+1, 1).Value - m
# Method 2: Directly call formula for calculation
for i in range(5):
    sht.api.Cells(i+1, 2).Value = app.api.Evaluate('=A' + str(i+1) + '-AVERAGE($A$1:$A$5)')
The following code uses two methods to calculate the maximum squared value of the given data. When using one method, comment out the other before running. The script file path is Samples\ch16\Python\Maximum squared value.py.
import xlwings as xw   # Import xlwings package
import os               # Import os package
root = os.getcwd()     # Get current path
# Create Excel application (visible, no workbook added initially)
app = xw.App(visible=True, add_book=False)
# Open data file (writable)
bk = app.books.open(fullname=root + r'\最大平方值.xlsx', read_only=False)
sht = bk.sheets.active  # Get worksheet
# Method 1: Directly call formula for calculation
sht.api.Cells(1, 3).Value = app.api.Evaluate('=MAX(A1:A5*A1:A5)')
# Method 2: Calculate maximum squared value via loop
max_val = 0.0
for i in range(5):
    v = sht.api.Cells(i+1, 1).Value
    if max_val < v * v:
        max_val = v * v
sht.api.Cells(1, 3).Value = max_val